
Executive Summary
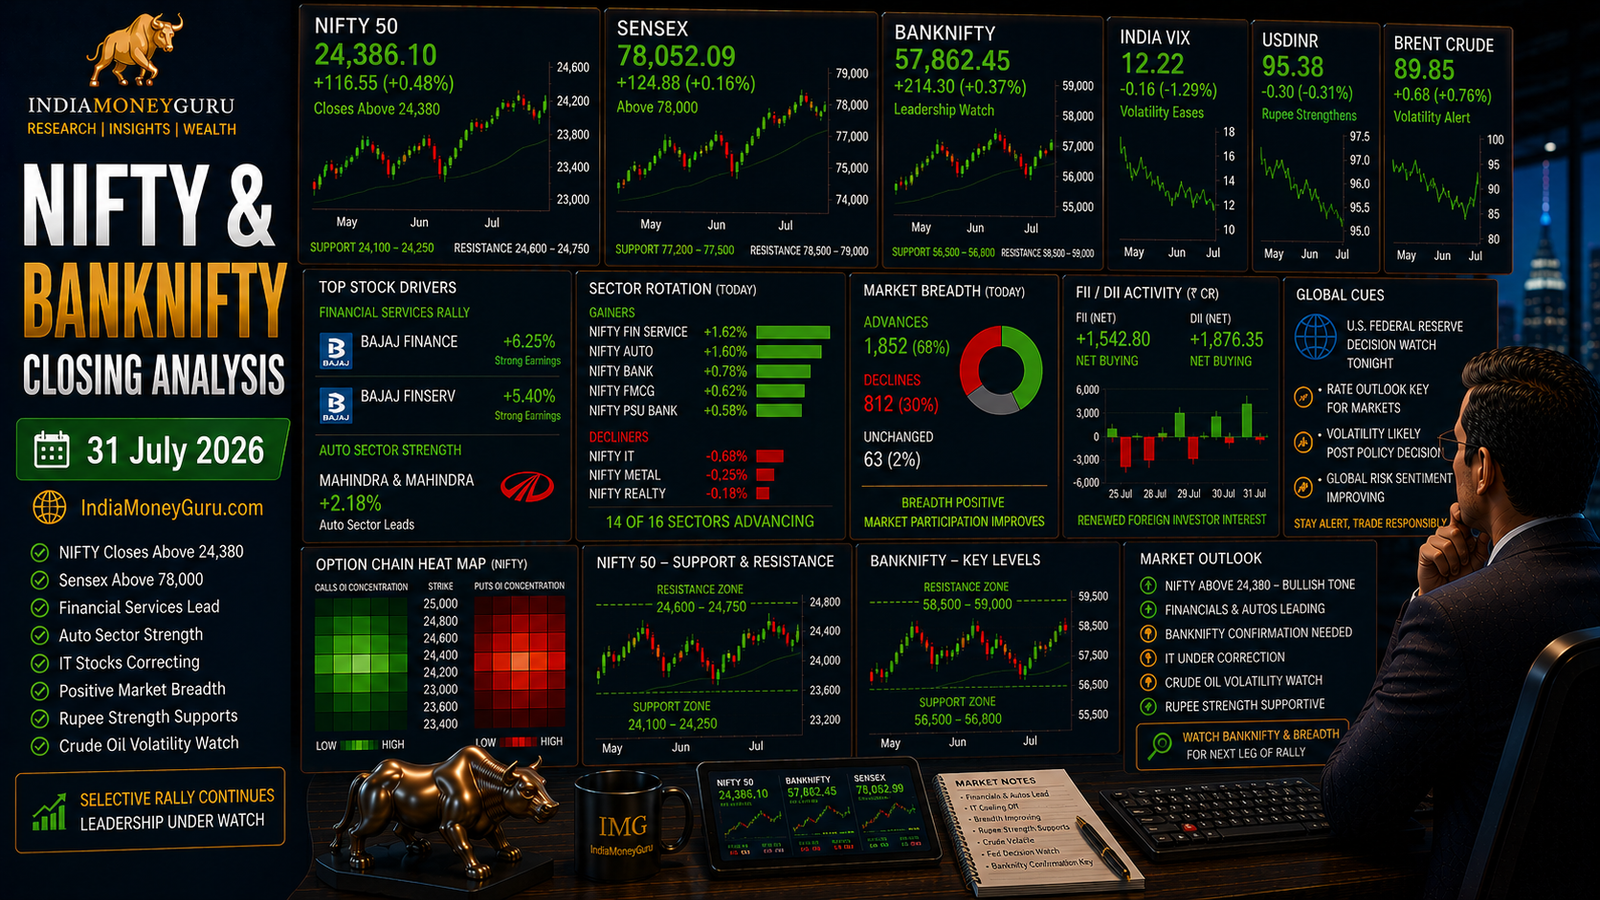
NIFTY & BANKNIFTY Closing Analysis 31 July 2026: Indian equity markets ended higher for the third consecutive session on Friday, 31 July 2026, but the market message was more balanced than the headline close suggested. The NIFTY 50 closed at 24,383.60, up 66.45 points, while the BSE Sensex closed at 78,094.64, up 166.49 points.
The day’s leadership came from financial services, autos and select large-cap names. Bajaj Finance and Bajaj Finserv led the rally after strong quarterly earnings. Mahindra & Mahindra also continued its strength, supported by earnings optimism and positive brokerage commentary.
The important counterweight was IT. After leading the recovery earlier in the week, IT stocks corrected sharply on Friday. TCS, Infosys, Tech Mahindra and other technology names came under pressure after a strong July rally. This makes today’s session different from Wednesday’s follow-through rally, where IT was the main driver.
BANKNIFTY and banking-related sentiment remained mixed. Financial services were strong because of the Bajaj twins, but large private banks did not deliver a clean leadership signal. HDFC Bank, ICICI Bank and Kotak Mahindra Bank closed lower in the Sensex pack, while SBI was marginally positive. This means the financial theme supported the market, but pure banking leadership still needs confirmation.
The broader market was better than Thursday. Economic Times reported positive NSE breadth, with 2,068 advancing stocks against 1,255 declining stocks and 112 unchanged. Midcaps and smallcaps also remained positive, rising more than 0.4%.
The rupee provided an important macro support. Reuters reported that the Indian rupee ended at 95.38 per dollar, gaining 0.3% on the day and nearly 1% for the week, marking its strongest weekly gain since March. RBI intervention and softer oil helped currency sentiment.
IndiaMoneyGuru View:
Today’s market was a controlled continuation, not a runaway rally. NIFTY is holding above 24,350, breadth improved, and financials/autos supported the move. But IT profit booking and mixed private-bank action mean the recovery still needs stronger BANKNIFTY confirmation before it can be called broad and durable.
Table of Contents
Market Intelligence Scorecard
| Indicator | Status | Interpretation |
|---|---|---|
| NIFTY Trend | 🟢 Positive | Closed above 24,380 after third straight gain |
| Sensex Trend | 🟢 Positive | Closed above 78,000 |
| BANKNIFTY / Banks | 🟡 Mixed | Financial services strong, private banks mixed |
| Market Breadth | 🟢 Positive | Advancers exceeded decliners on NSE |
| Financial Services | 🟢 Strong | Bajaj twins led the rally |
| Auto Sector | 🟢 Strong | M&M and auto names supported gains |
| IT Sector | 🔴 Weak | Corrected after a strong July rally |
| Midcaps / Smallcaps | 🟢 Positive | Broader participation improved |
| Rupee | 🟢 Strong | Best weekly gain since March |
| Crude Oil | 🟡 Watchful | Oil volatility remains a macro risk |
| Overall Bias | Cautiously Positive | Recovery continues, but leadership is rotating |
Previous Session vs Today
| Parameter | 30 July 2026 | 31 July 2026 | Interpretation |
|---|---|---|---|
| NIFTY 50 | 24,317.15 | 24,383.60 | Third straight positive close |
| Sensex | 77,928.15 | 78,094.64 | Closed above 78,000 |
| BANKNIFTY / Banks | Selective support | Mixed banking, strong financial services | Pure banking leadership still unclear |
| Market Breadth | Weak | Positive | Participation improved |
| IT Sector | Mildly positive | Weak | Profit booking after July rally |
| Auto Sector | Strong | Strong again | Continued leadership |
| Rupee | 95.68/USD | 95.38/USD | Currency strengthened |
| Market Tone | Index up, breadth weak | Index up, breadth improved | Better internal confirmation |
Market Snapshot
| Index / Indicator | Closing / Reading | Market Message |
|---|---|---|
| NIFTY 50 | 24,383.60 | Up 66.45 points; closed above 24,350 |
| Sensex | 78,094.64 | Up 166.49 points; third straight gain |
| NSE Breadth | 2,068 advances vs 1,255 declines | Positive breadth returned |
| Midcap / Smallcap Trend | More than 0.4% higher | Broader markets participated |
| Nifty IT | Down more than 2% | Profit booking after strong July gains |
| Financial Services ex-Banks | Up nearly 3% | Bajaj Finance and Bajaj Finserv led |
| Auto Sector | Strong | M&M and auto names supported gains |
| Rupee | 95.38/USD | Strongest weekly gain since March |
| Crude Oil | Volatile | Still a macro risk for India |
Market Overview
Friday’s session was a continuation of the recovery, but with a clear rotation in leadership. Unlike Wednesday, when IT stocks led the rally, today’s support came mainly from financial services, autos and select large caps.
The NIFTY closed above 24,350 and the Sensex crossed 78,000. This is constructive because the market has now held gains for three consecutive sessions after last week’s sharp correction. The recovery has therefore become more credible than the early-week relief bounce.
The biggest positive was market breadth. On Thursday, NIFTY closed higher, but mid-caps and small-caps were weak. Today, breadth improved and broader markets gained. This gives the rally a better internal structure.
Bajaj Finance and Bajaj Finserv were the standout leaders. Their strong Q1 earnings lifted financial services sentiment and helped offset pressure from IT. Mahindra & Mahindra also remained strong, extending its post-results momentum.
The main weakness came from IT. After a powerful July rally, IT stocks saw profit booking. This was not surprising because the sector had already moved sharply during the month. Reuters noted that Nifty IT remained up around 16% for July despite Friday’s fall.
BANKNIFTY’s message was mixed. Financials supported the market, but the banking pack did not show clean leadership. HDFC Bank, ICICI Bank and Kotak Mahindra Bank were weak in the Sensex pack, while SBI was only marginally positive. For a stronger index recovery, banks need to contribute more consistently.
The rupee was the day’s important macro support. It strengthened to 95.38 per dollar and posted its strongest weekly gain since March, helped by RBI intervention and softer oil. A stronger rupee is positive for foreign investor confidence, especially after crude volatility had pressured India earlier in July.
IndiaMoneyGuru Unique Insight
The most important insight from today’s session is:
The recovery is rotating, not broadening in a straight line.
This is the correct way to read the market.
On Wednesday, IT led the recovery. On Thursday, autos supported the index while broader markets weakened. On Friday, financial services and autos took leadership while IT corrected. This shows that money is not leaving the market aggressively; it is rotating between sectors.
That is positive.
But there is also a warning. A sustainable rally needs BANKNIFTY and private banks to participate more clearly. Financial services rallied today because Bajaj Finance and Bajaj Finserv were strong, but large private banks were mixed. This means the market’s financial leadership is still stock-specific rather than index-wide.
For IndiaMoneyGuru readers, the practical reading is simple:
- NIFTY’s short-term structure is positive.
- Breadth improved compared with Thursday.
- Autos and financial services are supporting the move.
- IT may need rest after a strong July rally.
- Rupee strength is a macro positive.
- BANKNIFTY still needs leadership confirmation.
- Crude oil remains the key external risk.
Today’s market should be read as a healthy but selective continuation, not as an aggressive breakout.
NIFTY Analysis
NIFTY closed at 24,383.60, gaining 66.45 points. The index extended its recovery for the third consecutive session and remained above the key 24,300 zone.
This is technically constructive. NIFTY has not only recovered from last week’s decline but has also started forming higher short-term levels. Economic Times noted that the index continues to form higher highs and higher lows on the daily chart.
The next challenge is sustainability. The market has moved sharply from last week’s lows, and sector leadership is rotating quickly. If NIFTY continues to hold above its support zone and breadth remains positive, the recovery can extend toward higher resistance levels.
However, traders should not ignore the IT correction. Since IT was the strongest support earlier in the week, its cooling means other sectors must carry the index. Today, financial services and autos did that job. Next week, BANKNIFTY and broader participation will become even more important.
For now, the NIFTY view remains cautiously positive.
BANKNIFTY Analysis
BANKNIFTY-related sentiment remained mixed on Friday.
Financial services were strong because Bajaj Finance and Bajaj Finserv rallied sharply after earnings. This helped the market and supported the broader financial theme. However, pure banking leadership was not decisive. HDFC Bank, ICICI Bank and Kotak Mahindra Bank were weak, while SBI was only marginally positive.
This distinction matters. NIFTY can rise for a few sessions with support from IT, autos and financial services. But a durable index rally usually needs private banks and BANKNIFTY to participate more clearly.
The banking index has improved from last week’s weakness, but it has not yet become the main leader. Until that happens, traders should treat the recovery as positive but selective.
For BANKNIFTY traders, the next session should be watched for follow-through from private banks. If HDFC Bank, ICICI Bank and Axis Bank start supporting together, the broader market recovery will become stronger. If banks remain mixed, NIFTY may continue to depend on rotating leadership from non-bank sectors.
Option Chain Intelligence
The option-chain structure remains constructive but requires discipline.
NIFTY has moved above the earlier 24,000 battleground and is now holding above 24,350. This means the market has shifted from breakdown repair to continuation testing. If the index sustains above the support zone, Put writing can strengthen, and short-covering may extend toward higher zones.
At the same time, the index is approaching resistance areas after a fast recovery. This can encourage Call writing or profit booking if momentum slows.
For BANKNIFTY, the message is less clear. Financial services were strong, but bank-stock participation was mixed. This makes aggressive bullish positioning in BANKNIFTY less attractive unless the index shows stronger confirmation.
This is the message of derivatives.
NIFTY is positive, but before traders can anticipate a widespread financial-sector breakout, BANKNIFTY still needs stronger leadership.
Institutional Activity
Institutional sentiment has improved compared with last week.
Economic Times reported that FIIs cumulatively bought equities worth ₹7,360 crore over the last three days, according to market commentary quoted in its report. This buying is not yet a long-term trend, but it is important because foreign flows had been cautious earlier due to crude and rupee pressure.
Reuters also reported that the rupee posted its strongest weekly gain since March, supported by persistent central-bank intervention. A stronger rupee helps reduce currency risk for foreign investors and improves India’s relative attractiveness.
The broader July picture is also constructive. Reuters noted that NIFTY and Sensex gained about 2% in July, supported by resilient June-quarter earnings, RBI measures to support the rupee and the return of foreign inflows after four months.
The institutional message is:
- FII interest has improved recently.
- Rupee strength supports foreign flows.
- Earnings are helping stock-specific confidence.
- India is being viewed as relatively stable compared with volatile AI-heavy global markets.
- Crude remains the main macro risk to monitor.
India VIX Analysis
India VIX remained in a calm volatility regime this week after cooling earlier from last week’s elevated readings. Low volatility has helped the market recover without sharp panic swings.
However, low VIX should not be treated as a guarantee of low risk. When markets rise quickly and sector leadership rotates, volatility can return suddenly if crude rebounds, the rupee weakens, or global markets turn risk-off.
For option sellers, the environment remains better than last week, but defined-risk strategies are still preferable. For directional traders, positive price action is supportive, but BANKNIFTY confirmation and breadth should be monitored closely.
The VIX message is simple: fear is low, but selectivity is high.
Sector Rotation
| Sector / Segment | Trend | Interpretation |
|---|---|---|
| Financial Services ex-Banks | Strong | Bajaj twins led the rally |
| Auto | Strong | M&M and auto names extended gains |
| Oil & Gas | Positive | Supported broader index stability |
| IT | Weak | Profit booking after strong July rally |
| FMCG | Weak | ITC and select names dragged |
| BANKNIFTY / Banks | Mixed | Private banks lacked clean leadership |
| Midcaps | Positive | Broader participation improved |
| Smallcaps | Positive | Risk appetite better than Thursday |
| Overall Market | Positive but Selective | Rotation continued across sectors |
The sector message was better than Thursday because breadth improved. But leadership rotated away from IT toward financial services and autos.
Support and Resistance
| Index | S1 | S2 | S3 | R1 | R2 | R3 |
|---|---|---|---|---|---|---|
| NIFTY | 24,300 | 24,200 | 24,000 | 24,500 | 24,600 | 24,750 |
| BANKNIFTY | 57,000 | 56,750 | 56,500 | 57,500 | 58,000 | 58,300 |
Trading Plan for Next Session
The next session should be treated as a continuation test after three positive sessions.
For NIFTY traders, the key is whether the index can hold above its support zone and move toward higher resistance without losing breadth. If breadth remains positive, the rally can continue. If breadth weakens again, traders should expect consolidation.
For BANKNIFTY traders, the focus should remain on private-bank confirmation. Financial services helped today, but the banking index needs broader participation from HDFC Bank, ICICI Bank, Axis Bank and SBI.
For option sellers, low volatility supports premium strategies, but the market has already moved sharply from last week’s lows. Avoid oversized naked exposure.
For intraday traders, watch leadership in the first hour. If IT remains weak and banks do not improve, NIFTY may become more dependent on autos and financial services.
For swing traders, prefer sectors where earnings support price action. Avoid chasing stocks that have already moved sharply without fresh confirmation.
Risk Factors to Watch
Key risks for the next session include:
- NIFTY failing near the 24,500–24,600 zone;
- BANKNIFTY not confirming leadership;
- IT profit booking continuing;
- financial-services rally narrowing only to Bajaj twins;
- crude oil volatility returning;
- rupee losing recent strength;
- FII buying failing to continue;
- global AI-trade volatility affecting sentiment;
- midcap-smallcap breadth weakening again;
- earnings disappointments from index heavyweights.
The biggest immediate risk is leadership rotation becoming leadership exhaustion. If IT cools, autos pause and banks do not strengthen, NIFTY may consolidate after the recent rally.
Trading Lessons
Today’s session gives three important lessons.
First, a positive index close does not always mean the same sector is leading every day. Leadership can rotate quickly.
Second, broad market participation matters. Friday’s improved breadth was a healthier signal than Thursday’s narrow index gain.
Third, BANKNIFTY confirmation remains critical. A financial-services rally led by Bajaj Finance is positive, but sustained market strength needs broader banking support.
Key Takeaways
For investors, the market recovery has improved, but stock selection remains important.
For traders, NIFTY is constructive above its support zone, but chasing after three positive sessions should be avoided.
For BANKNIFTY traders, private-bank follow-through remains the missing confirmation.
For option sellers, low volatility is helpful, but position sizing must remain disciplined.
For swing traders, autos and earnings-backed financial names remain in focus, while IT may need consolidation after a strong July move.
Editorial Conclusion
Indian markets closed higher for the third consecutive session on 31 July 2026. NIFTY ended at 24,383.60, Sensex closed at 78,094.64, and market breadth improved meaningfully from the previous session.
The rally was supported by financial services, autos and select large-cap stocks. Bajaj Finance, Bajaj Finserv and Mahindra & Mahindra were among the key gainers. The rupee also provided macro support by posting its strongest weekly gain since March.
However, the market was not uniformly strong. IT stocks corrected after a sharp July rally, and private banks remained mixed. This means the recovery is still selective and rotating.
IndiaMoneyGuru View:
The market is improving, but the next phase needs stronger BANKNIFTY confirmation. NIFTY has held higher levels, and breadth has improved, which is positive. But traders should stay disciplined because the rally has already covered meaningful ground from last week’s lows.
Related Articles
- NIFTY & BANKNIFTY Closing Analysis – 30 July 2026
- NIFTY & BANKNIFTY Closing Analysis – 29 July 2026
- NIFTY & BANKNIFTY Closing Analysis – 28 July 2026
- NIFTY & BANKNIFTY Closing Analysis – 27 July 2026
- NIFTY & BANKNIFTY Weekly Market Wrap-Up – Week Ending 24 July 2026
- NIFTY & BANKNIFTY Closing Analysis – 24 July 2026
Frequently Asked Questions (FAQs)
What was the NIFTY closing level on 31 July 2026?
NIFTY 50 closed at 24,383.60, up 66.45 points.
What was the Sensex closing level on 31 July 2026?
Sensex closed at 78,094.64, up 166.49 points.
Why did the Indian stock market rise today?
The market rose because financial services, autos and select large-cap stocks supported the indices, while broader market breadth remained positive.
Which stocks led today’s rally?
Bajaj Finance, Bajaj Finserv and Mahindra & Mahindra were among the key gainers, supported by earnings optimism.
Why did IT stocks fall today?
IT stocks saw profit booking after a strong July rally. The Nifty IT index had already gained sharply during the month.
Did BANKNIFTY lead the market today?
BANKNIFTY-related sentiment was mixed. Financial services supported the market, but large private banks did not show clean leadership.
What happened to the rupee today?
The rupee closed at 95.38 per dollar, posting its strongest weekly gain since March, supported by RBI intervention and softer oil.
Is the market recovery confirmed now?
The recovery is improving, but full confirmation still needs stronger BANKNIFTY participation and sustained breadth.
References
Disclaimer
The information provided in this article is for educational purposes only and should not be considered investment advice. Trading and investing in financial markets involve risk. Always conduct your own research and consult a qualified financial advisor before making investment decisions.