
Market Overview
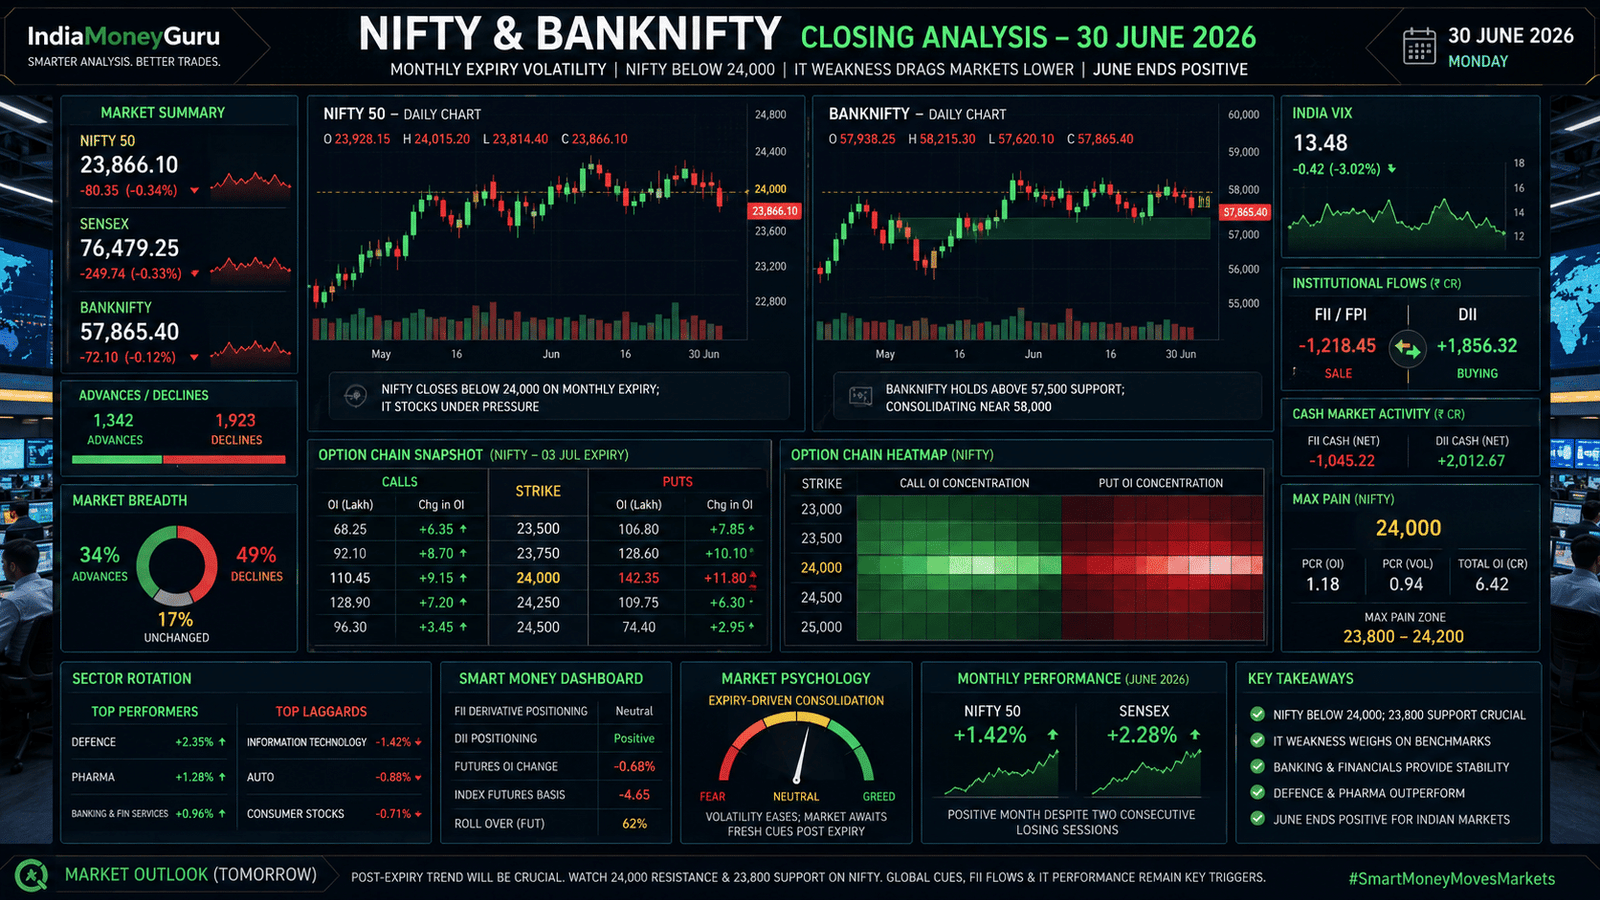
Indian markets traded in a volatile range on monthly expiry before closing lower. Selling pressure remained concentrated in information technology stocks amid concerns that elevated U.S. interest rates could continue to weigh on global technology spending.
Despite today’s decline, June ended on a constructive note. Lower crude oil prices, RBI measures supporting foreign capital inflows and strong banking-sector performance helped the NIFTY gain about 1.4% and the Sensex about 2.3% during the month.
Executive Summary
Market Mood: Neutral to Slightly Bearish
Today’s Theme: Monthly expiry volatility and continued weakness in IT stocks kept benchmark indices under pressure, although June concluded with healthy gains for the broader market.
Table of Contents
Market Snapshot
- NIFTY 50 closed near 23,866, down about 0.34%.
- Sensex closed near 76,479, down about 250 points.
- This was the second consecutive losing session.
- Monthly derivatives expiry added volatility.
- IT remained the weakest sector.
- Defence stocks outperformed during the session.
- India VIX eased to around 13.48, suggesting controlled volatility despite the decline.
Market Scorecard
| Indicator | Status |
| NIFTY | 🔴 Below 24,000 |
| BANKNIFTY | 🟡 Consolidating |
| India VIX | 🟢 Stable near 13.5 |
| FII Activity | 🟡 Mixed |
| DII Activity | 🟢 Supportive |
| Option Writers | 🟡 Active around 24,000 |
| Overall Bias | Neutral |
Yesterday vs Today
| Indicator | 29 Jun | 30 Jun |
|---|---|---|
| NIFTY | 23,946 | 23,866 |
| Sensex | 76,728 | 76,479 |
| India VIX | Moderate | Slightly Lower |
| Market Bias | Defensive | Expiry-driven Consolidation |
NIFTY Analysis
NIFTY continued trading below the key psychological level of 24,000.
Key observations
- Immediate support: 23,800
- Strong support: 23,600
- Immediate resistance: 24,000
- Next resistance: 24,200
A decisive move back above 24,000 would improve short-term momentum. To learn more about how NIFTY works, read our Complete Guide to NIFTY Analysis for Indian Traders.
BANKNIFTY Analysis
BANKNIFTY remained relatively resilient compared with the IT-heavy benchmark.
Key observations
- Support: 57,500
- Strong support: 57,000
- Resistance: 58,300–58,500
The banking sector continues to provide stability to the broader market. To learn more about how BANKNIFTY works, read our Complete Guide to BANKNIFTY Analysis for Indian Traders.
Option Chain Intelligence
Current positioning indicates:
- Strong option activity around the 24,000 strike.
- Expiry-related adjustments increased intraday volatility.
- Put writers are expected to defend lower support if global sentiment remains stable.
To learn more about how option chain works, read our Complete Guide to Option Chain Analysis in India.
Sector Rotation
Leaders
- Defence
- Pharma
- Banking & Financial Services
Laggards
- Information Technology (IT)
- Auto
- Consumer Stocks
While banking remained relatively resilient, today’s gains were led primarily by defence names, whereas IT extended its losing streak.
Smart Money Dashboard
Institutional positioning suggests that investors are rotating toward sectors with stronger domestic demand and government spending themes while reducing exposure to export-oriented technology stocks.
To learn more about how FII and DII trading strategies impact the market, read our How FII and DII Activity Impacts NIFTY.
Market Psychology
Today’s session reflected expiry-driven repositioning rather than panic selling.
The decline was orderly, accompanied by a modest fall in India VIX, indicating that traders remain cautious but not excessively fearful.
Trap of the Day
Expiry Volatility Trap
Large intraday swings around the 24,000 level tempted both buyers and sellers, but expiry positioning rather than a fundamental shift in trend largely drove today’s price action.
Tomorrow’s Key Levels
| S1 | S2 | R1 | R2 | |
| NIFTY | 23,800 | 23,600 | 24,000 | 24,200 |
| BANKNIFTY | 57,500 | 57,000 | 58,300 | 58,500 |
To learn more about how to find support and resistance, read our How to Identify Support and Resistance Using Option Chain Analysis.
Risk Management Notes
- Watch for post-expiry trend confirmation.
- Monitor FII flows at the start of the new monthly series.
- Continue tracking India VIX for signs of changing volatility.
- Focus on relative-strength sectors rather than chasing weak momentum.
To learn more about managing your trade risk, read our BANKNIFTY Risk Management Guide that will give an idea about the position sizing, stop-loss & how you can protect your capital loss.
Monthly Closing Perspective
June concluded as a constructive month despite the last two sessions of weakness.
Highlights:
- NIFTY gained approximately 1.4% during June.
- Sensex advanced around 2.3%.
- Banking & Financial Services delivered strong monthly leadership.
- Pharma also outperformed.
- IT remained the weakest major sector throughout the month.
Conclusion
The NIFTY BANKNIFTY Closing Analysis 30 June 2026 reflects a market undergoing healthy consolidation after a positive month. Monthly expiry contributed to volatility, while persistent weakness in IT weighed on benchmark indices. However, strength in banking, defence and pharma sectors, together with stable volatility, suggests that the broader market structure remains constructive heading into the new monthly derivatives series.
FAQs
Why did NIFTY fall on 30 June 2026?
Selling pressure in IT stocks combined with monthly expiry volatility kept the market under pressure.
Was monthly expiry responsible for today’s volatility?
Yes. Position adjustments around monthly derivatives expiry contributed to larger intraday swings.
Which sectors performed best?
Defence, Pharma and Banking & Financial Services showed relative strength.
What is the most important NIFTY level?
24,000 remains the key resistance, while 23,800 is the first important support.
Disclaimer
The information provided in this article is for educational purposes only and should not be considered investment advice. Trading and investing in financial markets involve risk. Always conduct your own research and consult a qualified financial advisor before making investment decisions.