

Table of Contents
When global crude oil prices surge past $100 or $110 per barrel, stock market headlines in India inevitably turn cautious. For retail investors watching their portfolios, the immediate question is simple: Why does a spike in international crude oil trigger sharp selling on Dalal Street, even when Indian companies report steady corporate earnings?
The answer lies in understanding the crude oil impact on Indian stock market dynamics through macro transmission channels. Energy shocks do not hit equities in isolation. Instead, they trigger a domino effect that moves through currency markets, central bank interest rate decisions, government bond yields, and institutional capital flows.
While volatility during rate cycles can spill into expiry sessions, understanding SEBI’s updated 30-minute VWAP derivatives settlement framework helps traders navigate end-of-day price discovery without panic.
What Happened: $110 Crude Oil and the RBI’s Rate Hike
In October 2026, Brent crude oil prices broke above $100–$110 per barrel due to persistent supply constraints in the Middle East and rising global shipping freight rates. For India, which imports nearly 85% of its crude oil requirements, this surge significantly expanded the national import bill, which climbed past $90 billion over the April–September period.
In response to rising imported inflation risk and currency volatility (USD/INR trading near ₹95.00), the Reserve Bank of India (RBI) Monetary Policy Committee raised the repo rate by 25 basis points to 5.50%. Simultaneously, India’s 10-year government bond yield rose for nine consecutive weeks to reach 7.38%.
Concurrently, foreign portfolio investors (FPIs) pulled out over ₹52,000 crore from Indian equities during October 2026, reallocating capital toward safer 5%+ US Treasury yields and valuation-depressed Asian technology markets.
To make sense of these concurrent moves, investors must trace the underlying transmission mechanics step by step.
How It Actually Works: The 5-Step Macro Transmission Loop
A clear 5-step financial transmission chain governs the relationship between crude oil prices and domestic stock prices:
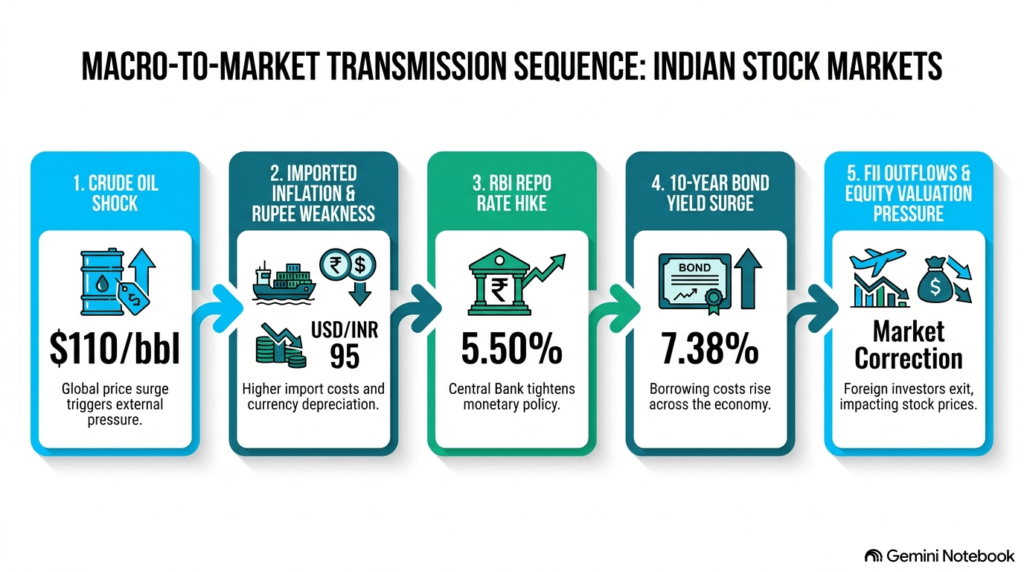
Step 1: Crude Oil Price Shock ($110/bbl)
Because crude oil is a foundational input for transportation, logistics, plastics, paints, aviation, and chemical manufacturing, higher crude prices immediately inflate production costs across domestic industries.
Step 2: Imported Inflation & Currency Pressure
As Indian importers buy dollars to settle higher oil bills, demand for USD surges relative to the Rupee. A weaker Rupee makes all other imported commodities more expensive, creating imported inflation.
Step 3: Central Bank Action (RBI Repo Hike to 5.50%)
To prevent inflation from spilling into broader household inflation expectations and to support currency stability, the RBI steps in to tighten monetary policy by raising the repo rate.
Step 4: Surge in Government Bond Yields (7.38%)
When repo rates rise, yields on government securities (G-Secs) rise across the curve. The 10-year bond yield represents the benchmark risk-free rate for the entire economy.
Step 5: Capital Reallocation & Equity Valuation Compression
As risk-free bond yields become more attractive, institutional investors reallocate funds from risky equities into fixed income. Additionally, higher risk-free rates compress stock valuation multiples (P/E ratios).
The Math Behind Bond Yields and Equity Discount Rates
To understand why rising bond yields force stock valuations down, investors can look at the basic Discounted Cash Flow (DCF) valuation framework used by institutional analysts:
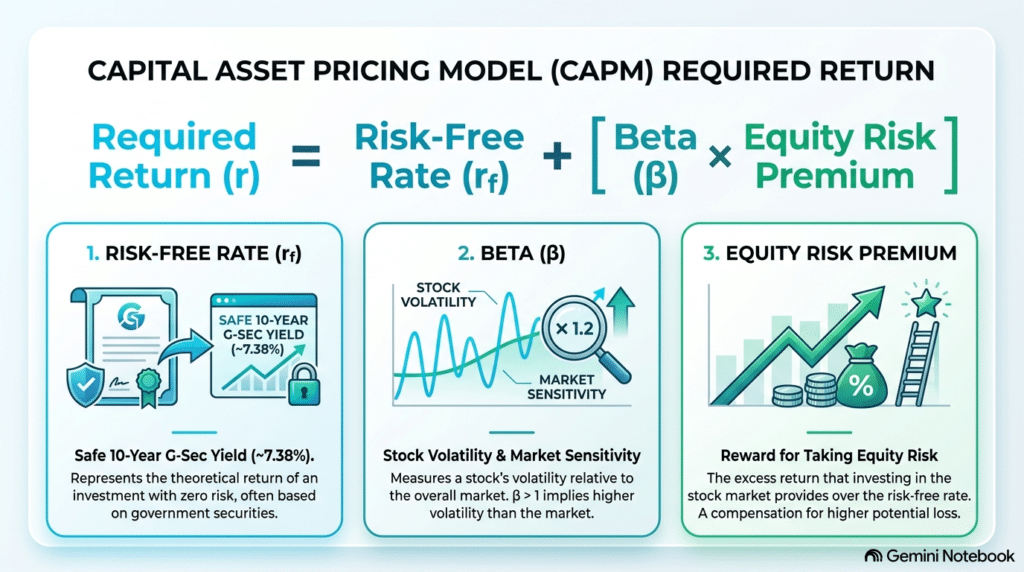
The 3 Building Blocks Explained
1. Risk-Free Rate (rf): The Safe Baseline
- What it means: The guaranteed return you get without taking any risk of losing your principal, typically measured by the 10-Year Indian Government Bond (G-Sec) yield, which is currently around 7.38%. This can be understood as: “If the Government of India pays me 7.38% risk-free, I won’t touch a stock unless it promises significantly more than 7.38%.“
2. Beta (β): The Volatility Gauge
- What it means: How wild or sensitive a stock is compared to the broader Nifty 50 index.
- β = 1.0: The stock moves at the exact same pace as Nifty.
- β = 1.5 (High Risk): If Nifty drops 10%, this stock drops 15% (e.g., realty or midcap stocks).
- β = 0.6 (Low Risk/Defensive): If Nifty drops 10%, this stock only drops 6% (e.g., FMCG or pharma stocks).
- This scenario can be taken as: “How much harder will this specific stock punch a trader or an investor if the market falls?”
3. Equity Risk Premium (ERP): The Market Hazard Bonus
- What it means: The extra return investors demand just for investing in equities instead of keeping their money in safe government bonds (historically around 4%–6% in India). So, ERP can be understood as “The extra profit bonus one can demand to accept stock market uncertainty”.
This financial math explains why stock prices fall during rate hike cycles even if corporate profits continue to grow at a healthy pace.
Sectoral Impact: Winners, Losers, and Defensive Plays
The crude oil impact on Indian stock market sectors is far from uniform. Different industries experience vastly different margin pressures:
| Sector | Direct Impact of $110 Crude | Margin Trend | Investor Consideration |
|---|---|---|---|
| Paints & Adhesives | Raw material costs rise significantly (monomers/solvents derived from crude) | 🔴 Compressed | Requires monitoring of pricing power |
| Aviation & Logistics | Aviation Turbine Fuel (ATF) accounts for 40%+ of operating costs | 🔴 Compressed | Vulnerable to rapid fuel surcharge lag |
| Oil Exploration (ONGC/OIL) | Realizations per barrel increase on domestic production | 🟢 Expanded | Benefits directly from higher crude realisations |
| Upstream Refining & Marketing | Refining margins expand while marketing margins face retail price freezes | 🟡 Mixed | Depends on government retail price policy |
| IT Services | Indirect benefit from USD strength vs INR, but offset by US client rate pressures | 🟡 Neutral | Currency tailwinds balance macro headwinds |
Institutional order flow during macro events often concentrates around the close, making Closing Auction Session mechanics critical for understanding institutional positioning.
Important Nuance: Short-Term Multiples vs. Long-Term Earnings Growth
A common misunderstanding among retail investors is assuming that a spike in crude oil guarantees a long-term bear market.
It is important to distinguish between valuation multiple compression and underlying earnings growth:
- Multiple Compression: When interest rates rise, investors are willing to pay fewer Rupees per Rupee of earnings (e.g., a stock’s P/E multiple compresses from 35x to 28x).
- Earnings Growth: If India’s real GDP growth remains strong (6.5%–7.0%) and corporate balance sheets are deleveraged, long-term earnings per share (EPS) growth will eventually absorb short-term valuation adjustments.
While energy shocks create near-term volatility, high-quality businesses with strong pricing power eventually pass on input cost increases to consumers.
What Investors Should Watch Next
As markets absorb ongoing energy and interest rate developments, investors should track three critical indicators:
- Brent Crude Range: A sustained drop back below $85/barrel would relieve inflation expectations and allow bond yields to cool.
- 10-Year US Treasury Yields: If US yields ease from 5.0%+ levels, the interest rate differential between the US and India stabilizes, slowing FII equity selling.
- RBI Liquidity Management: Watch OMO (Open Market Operations) and VRRR auctions to see how the central bank maintains systemic banking liquidity during high-yield periods.
Intraday options traders refining their Nifty expiry day trading strategies should account for how rate hikes impact implied volatility and option Greeks.
IndiaMoneyGuru Takeaway
Global energy shocks compress equity valuations, but they do not destroy strong corporate business models. When crude oil spikes and the RBI raises interest rates, markets adjust prices to reflect higher discount rates. Intelligent investors use macro-driven pullbacks to evaluate fundamental business strength rather than reacting emotionally to temporary interest rate cycles.
Frequently Asked Questions (FAQs)
How does a crude oil price spike affect the Indian stock market?
India imports nearly 85% of its oil. Higher crude prices widen the trade deficit, weaken the Rupee, increase corporate input costs, and trigger RBI rate hikes, which lower stock valuation multiples.
Why do foreign investors (FIIs) sell Indian equities when oil prices rise?
Rising oil prices increase inflation and currency depreciation risks in India and drive up bond yields globally. Foreign funds reallocate capital toward higher-yielding US Treasuries and lower-risk assets.
Which sectors in India face the worst impact from high crude oil prices?
Paints, tires, speciality chemicals, aviation, logistics, and consumer discretionary sectors face margin compression due to elevated raw material and freight costs.
Disclaimer
The information provided in this article is for educational purposes only and should not be considered investment advice. Trading and investing in financial markets involve risk. Always conduct your own research and consult a SEBI-registered investment adviser before making any investment decisions.