
Table of Contents
A Market Month Is More Than Its Final Percentage
NIFTY & BANKNIFTY Monthly Market Review August 2026: At the end of every month, investors see one number: How much did NIFTY rise or fall? Useful? Yes. Enough to understand the market? Not even close. August 2026 is a perfect example.
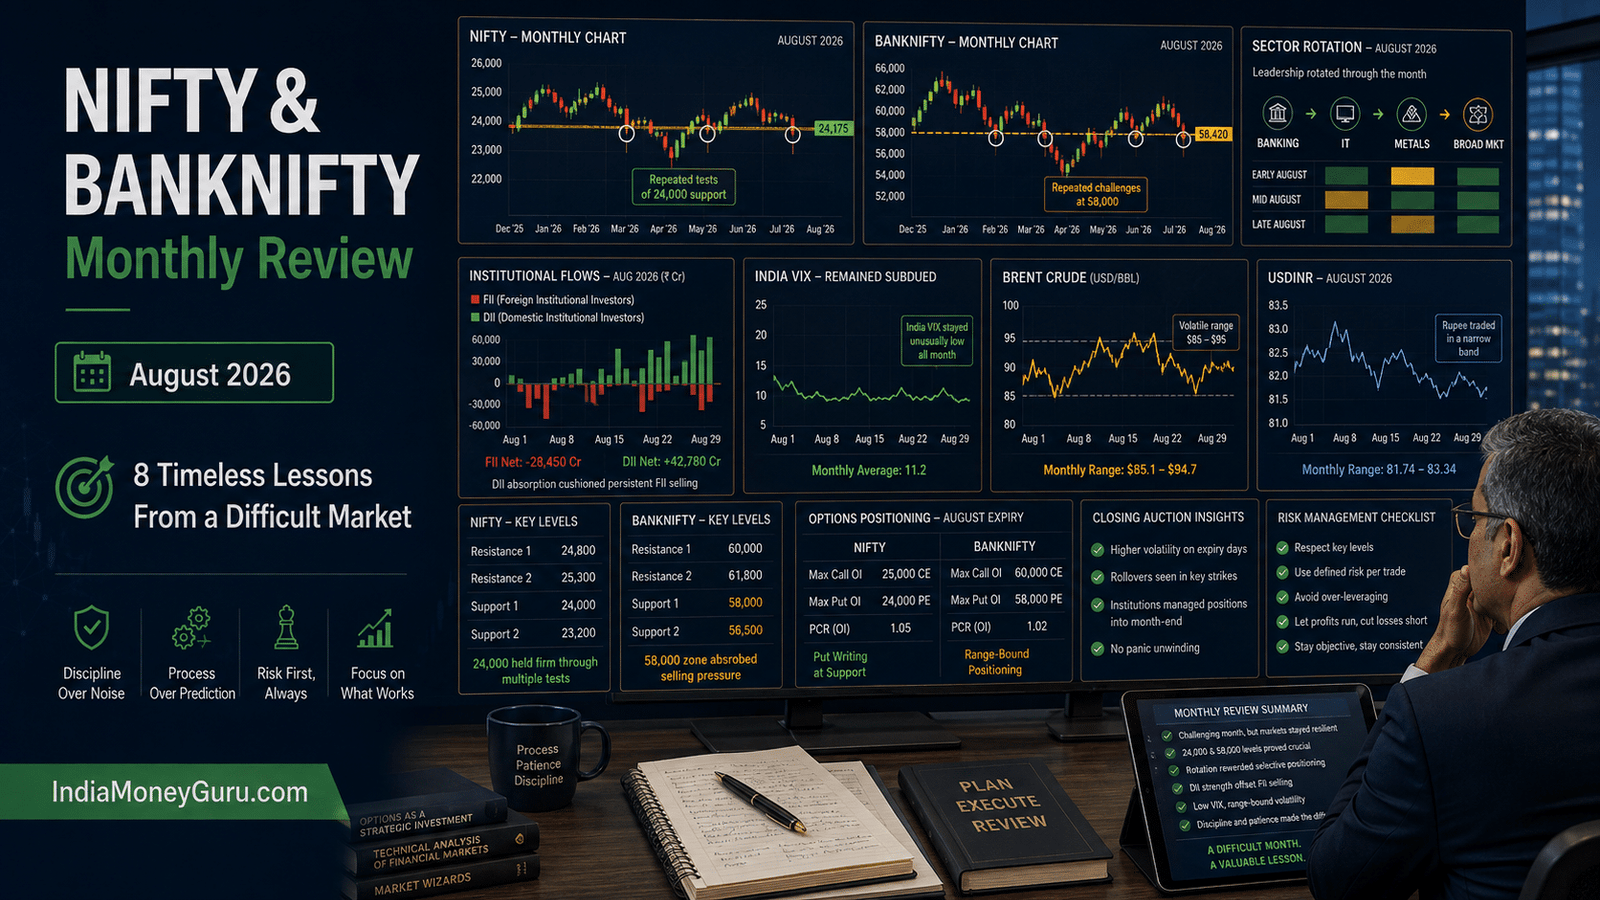
NIFTY finished the month at 24,080.40, while BANKNIFTY closed at 58,024.95. The headline indices struggled. NIFTY and Sensex lost roughly 1.2%–1.5% during August. But underneath those numbers, traders witnessed something much more valuable:
Repeated support tests. Sector rotation. Oil shocks. Foreign selling. Domestic buying. Expiry volatility. A new closing-auction mechanism. And several rallies that looked convincing until they weren’t.
That makes August worth studying even after the month’s closing prices are no longer current. Because markets change. Trader behaviour doesn’t change nearly as much as the markets do.
August 2026 Market Snapshot
| Indicator | Month-End Picture |
|---|---|
| NIFTY 50 | 24,080.40 |
| BANKNIFTY | 58,024.95 |
| Sensex | 76,957.27 |
| India VIX | ~11.19 |
| USD/INR | ~₹95.16 |
| India’s Q1 FY27 GDP Growth | 7.8% |
| Key NIFTY Zone | 24,000–24,400 |
| Key BANKNIFTY Zone | 57,000–58,300 |
The numbers matter. But the story behind them matters more.
Lesson #1: Support Is a Zone, Not a Magic Number
One of the strongest lessons from August came from NIFTY 24,000. The index repeatedly moved towards this area. Occasionally it traded below nearby levels intraday. Sometimes sellers appeared ready to take control. Yet buyers repeatedly returned.
On the final trading day, NIFTY fell to around 23,994 before recovering above 24,000. This teaches an important technical-analysis principle.
A support level should rarely be treated as “24,000 touched. Buy immediately.” A better way to think about it is that the market has entered the 24,000 support area. Now watch how price behaves.”
- Does selling accelerate?
- Does volume increase?
- Does price recover quickly?
- Do writers defend the area?
- Do BANKNIFTY and broader indices confirm the move?
The reaction around support is often more informative than the support number itself. This is why our 31 August NIFTY & BANKNIFTY closing analysis focused heavily on whether NIFTY could continue defending the 24,000 region rather than simply declaring it bullish or bearish.
Lesson #2: NIFTY and BANKNIFTY Do Not Always Tell the Same Story
Another recurring August theme was divergence. There were sessions when NIFTY struggled, but banks remained resilient. There were other sessions when IT stocks pushed NIFTY higher while BANKNIFTY barely participated.
For example, the 28 August closing analysis showed NIFTY recovering as NIFTY IT surged by roughly 3.5%, while BANKNIFTY remained almost unchanged at around 57,500. Three sessions earlier, our 25 August closing analysis showed another recovery where BANKNIFTY again failed to provide strong confirmation.
This information matters because NIFTY is not “the market”. Neither is BANKNIFTY.
A trader should ask:
- Which index is leading?
- Which sector is driving the index?
- Is the broader market confirming the move?
A NIFTY breakout powered by one heavyweight sector can behave very differently from a breakout supported by banks, IT, industrials and broader-market participation together.
Lesson #3: Sector Rotation Can Hide Beneath a Weak Index
This may be the most reusable lesson from August. The headline index often looked weak. Yet money did not simply leave equities. It rotated. IT strengthened sharply in some sessions. Banks led in others. Metals occasionally outperformed. Midcaps and smallcaps showed periods of relative resilience even while NIFTY struggled. That is why traders should avoid reducing every session to the following:
NIFTY green = bullish.
NIFTY red = bearish.
Instead, look one layer deeper. If NIFTY is down 0.4%, but several sectors and the broader market are holding up well, the internal structure is different from a session where 14 out of 16 sectors are collapsing together.
Our weekly market wrap-up for 28 August captured this behaviour exactly: headline weakness existed alongside resilience in parts of the broader market.
Lesson #4: Crude Oil Is Not Background Noise for Indian Markets
For Indian investors, crude oil deserves a permanent place on the dashboard. India imports roughly 85% of its crude requirements, making sustained increases in oil prices relevant for inflation, the current account, the rupee, corporate margins and eventually interest-rate expectations.
August demonstrated this relationship repeatedly. Brent moved from uncomfortable levels above $90 to the high-$80s before geopolitical tensions pushed it back to $90 near month-end. Whenever crude eased, Indian equities received some macro relief. Whenever it accelerated, inflation and currency concerns returned. This does not mean:
Oil up = NIFTY must fall.
Markets are rarely that simple. It means crude is one of the variables that changes the probability structure for an oil-importing economy. That distinction is important.
Lesson #5: FII Selling Does Not Automatically Mean the Market Must Collapse
Foreign Institutional Investor flows receive enormous attention. They should. But they should not be interpreted alone. August again demonstrated the importance of Domestic Institutional Investors (DIIs).
When foreign investors sold, domestic institutions repeatedly absorbed part of that supply. This has created one of the most important structural changes in modern Indian markets. The question is no longer simply, “Are FIIs buying or selling?”
A better question is the following: “What is the net institutional balance between foreign selling and domestic absorption?”
Heavy FII selling combined with weak DII participation is very different from heavy FII selling accompanied by aggressive domestic buying. For long-term investors, this approach is an important framework for interpreting institutional-flow headlines without reacting emotionally to them.
Lesson #6: Low India VIX Does Not Mean Low Risk
India VIX spent much of late August around surprisingly low levels despite geopolitical uncertainty, crude volatility and repeated index swings. It ended the month around 11.19.
This creates a dangerous psychological trap. When VIX is low, options can appear inexpensive and market conditions can feel comfortable. Traders may increase their position sizes because the market “doesn’t look volatile”. But low implied volatility does not eliminate the following:
- gap risk,
- geopolitical risk,
- event risk,
- expiry risk,
- liquidity risk,
- or sudden volatility expansion.
The correct lesson is not Low VIX = safe market. The correct lesson is the following: Low VIX = the options market is currently pricing in relatively low expected volatility. Those are completely unique statements.
Position sizing should therefore remain based on capital at risk, not confidence. The IndiaMoneyGuru Position Size Calculator can help translate a predefined risk amount into an appropriate trade size.
Lesson #7: Closing Prices Can Matter More Than Intraday Drama
August 2026 also introduced Indian traders to an important market-structure change: the Closing Auction Session (CAS). The mechanism became especially visible during expiry and index-rebalancing sessions.
On 31 August, MSCI rebalancing produced roughly $4.1 billion of trading during NSE’s closing auction, according to Reuters. BANKNIFTY provided a dramatic example.
The index was trading much lower before the auction but ultimately settled at 58,024.95 after a sharp closing adjustment. That creates a valuable lesson extending beyond August: “Do not confuse an intraday price with the official closing structure.”
Closing prices influence charts, technical indicators, derivatives settlement references, index calculations and institutional portfolios. But traders should also ask why an unusual closing move occurred.
A technical breakout created by broad buying throughout the session may deserve more confidence than one produced largely by index-rebalancing flows during an auction. Context matters. For the latest update on CAS, you can read the article titled ‘How CAS Could Change F&O Expiry Settlement.‘
Lesson #8: A Strong Economy and a Weak Stock Market Can Exist Together
Perhaps the most important investing lesson arrived after the market closed on the final trading day. India’s economy grew 7.8% year-on-year in the April–June quarter, beating the market consensus of around 7.1%.
Manufacturing grew strongly, investment accelerated and domestic demand remained resilient. Yet NIFTY still finished August lower. Contradiction? No.
The economy and stock market are related, but they are not the same thing. Market price:
- future earnings,
- valuations,
- interest rates,
- liquidity,
- currencies,
- commodities,
- geopolitical risk,
- and expectations.
GDP measures economic activity. A strong economy can therefore coexist with a correcting stock market – particularly if valuations, oil prices or global financial conditions are moving in the opposite direction.
This distinction can prevent long-term investors from making one of the most common mistakes: assuming every strong economic headline must immediately produce a rising stock market.
What August Taught About False Breakouts
Several times during the month, NIFTY approached or crossed important resistance areas. BANKNIFTY repeatedly challenged 58,000. Yet follow-through was inconsistent. This brings us to another important trading principle: A breakout is not just a price crossing a line.
A higher-quality breakout often has several characteristics:
- price sustains beyond resistance,
- participation broadens,
- the leading sectors confirm,
- volume supports the move,
- the next session does not immediately reverse it.
This is why “wait for confirmation” is not boring advice. It is risk management.
A Better Monthly Review Framework for Traders
At the end of every month, instead of only checking your P&L, ask these questions:
- Market Structure: Was the index trending or ranging?
- Leadership: Which sectors consistently led?
- Breadth: Was the broader market confirming the headline indices?
- Institutional Flows: What were FIIs and DIIs doing?
- Volatility: Was India VIX expanding or contracting?
- Macro: What happened to crude oil, the rupee, inflation and interest-rate expectations?
- Technical Behaviour: Which support and resistance zones repeatedly mattered?
- Trading Behaviour: Where did your strategy work, and where did you force trades?
The final question is usually the most valuable one.
NIFTY and BANKNIFTY: What August Leaves Behind
Although this article is designed as a monthly study rather than a short-lived prediction, August leaves behind two technically important structures.
NIFTY
Structural support: 24,000 area
Immediate resistance: 24,200–24,400
Higher resistance: around 24,500+
A decisive move outside this structure can establish the next directional phase.
BANKNIFTY
Important support: 57,500–57,000
Immediate resistance: 58,200–58,300
Higher breakout area: above 58,300
BANKNIFTY’s month-end close above 58,000 is interesting, but confirmation after the unusual closing-auction move remains important.
These levels will eventually become outdated. However, the method used to identify and interpret these levels will remain valid.
What Investors Can Learn From August 2026
Traders often want the market to provide certainty. August provided something more useful: practice dealing with uncertainty. It showed why:
- support should be treated as a zone,
- index divergence matters,
- sector rotation deserves attention,
- FII data needs DII context,
- crude matters to India,
- low VIX does not eliminate risk,
- closing-market mechanics can influence charts,
- and economic strength does not guarantee immediate stock-market strength.
These are not lessons for August alone. They are frameworks that can be reused in almost any market cycle.
IndiaMoneyGuru Takeaway
- A profitable month can teach you bad habits.
- A difficult month can teach you excellent ones.
- August 2026 repeatedly tempted traders to chase moves.
- NIFTY recovered then stalled.
- BANKNIFTY approached 58,000 and then retreated.
- IT strengthened while banks weakened.
- Banks strengthened while NIFTY struggled.
- Crude fell and then geopolitical tension pushed it higher again.
- The trader who demanded certainty probably found August frustrating.
- The trader who thought in probabilities, ranges, confirmation and risk had something far more useful to work with.
That is perhaps the biggest lesson from the month: Good trading is not about predicting every move. It is about knowing what you will do when the market moves differently from what you expected. That lesson will remain useful long after August 2026 disappears from the charts.
FAQs
How did NIFTY perform in August 2026?
NIFTY finished August at 24,080.40 and recorded a monthly decline. The broader story, however, was one of repeated support near 24,000 and significant sector rotation beneath the headline index.
What was the most important NIFTY level during August 2026?
The 24,000 region emerged as the most important support area late in the month, while approximately 24,300–24,400 remained an important resistance region.
Why is BANKNIFTY important when analysing NIFTY?
Banks carry significant weight in Indian equities and often provide confirmation or divergence during major market moves. Comparing NIFTY with BANKNIFTY can therefore reveal whether a rally or decline has broad heavyweight participation.
How do crude oil prices affect the Indian stock market?
India imports most of its crude oil. Sustained higher prices can affect inflation, the rupee, India’s current account, corporate margins and interest-rate expectations, although the relationship with stock prices is not mechanically one-to-one.
Does a low India VIX mean the market is safe?
No. A low VIX indicates relatively low implied volatility expectations. It does not eliminate event risk, overnight gaps or sudden volatility expansion.
Why should investors track FII and DII flows together?
FII selling can create pressure, but strong domestic institutional buying may absorb part of that supply. Looking at both provides a more complete picture of institutional liquidity.
What can traders learn from a monthly market review?
A useful monthly review reveals market structure, sector leadership, institutional behaviour, volatility regimes, macro influences and weaknesses in the trader’s own process. These lessons are often more valuable than simply recording the month’s percentage return.
References
- Reuters: August month-end Indian equity market and MSCI rebalancing
- Reuters: India’s Q1 FY27 GDP grows 7.8%
- Reuters: Rupee records monthly gain and closes near four-week high
- Reuters: MSCI rebalancing tests India’s new Closing Auction Session
- Moneycontrol: NIFTY and BANKNIFTY technical structure at August month-end
Disclaimer
The information provided in this article is for educational purposes only and should not be considered investment advice. Trading and investing in financial markets involve risk. Always conduct your own research and consult a SEBI-registered investment adviser before making any investment decisions.
1 thought on “NIFTY & BANKNIFTY Monthly Market Review – August 2026: What a Difficult Month Can Teach Traders”