
BANKNIFTY Price Action Guide helps traders understand one of the most important aspects of technical analysis – reading price itself. While indicators and Option Chain data provide valuable information, price remains the final reflection of buying and selling activity.
Professional traders often say that “price discounts everything.” Every news event, institutional order, and shift in market sentiment eventually appears in price movement. Learning to interpret these movements can help traders identify high-probability trading opportunities with greater confidence.
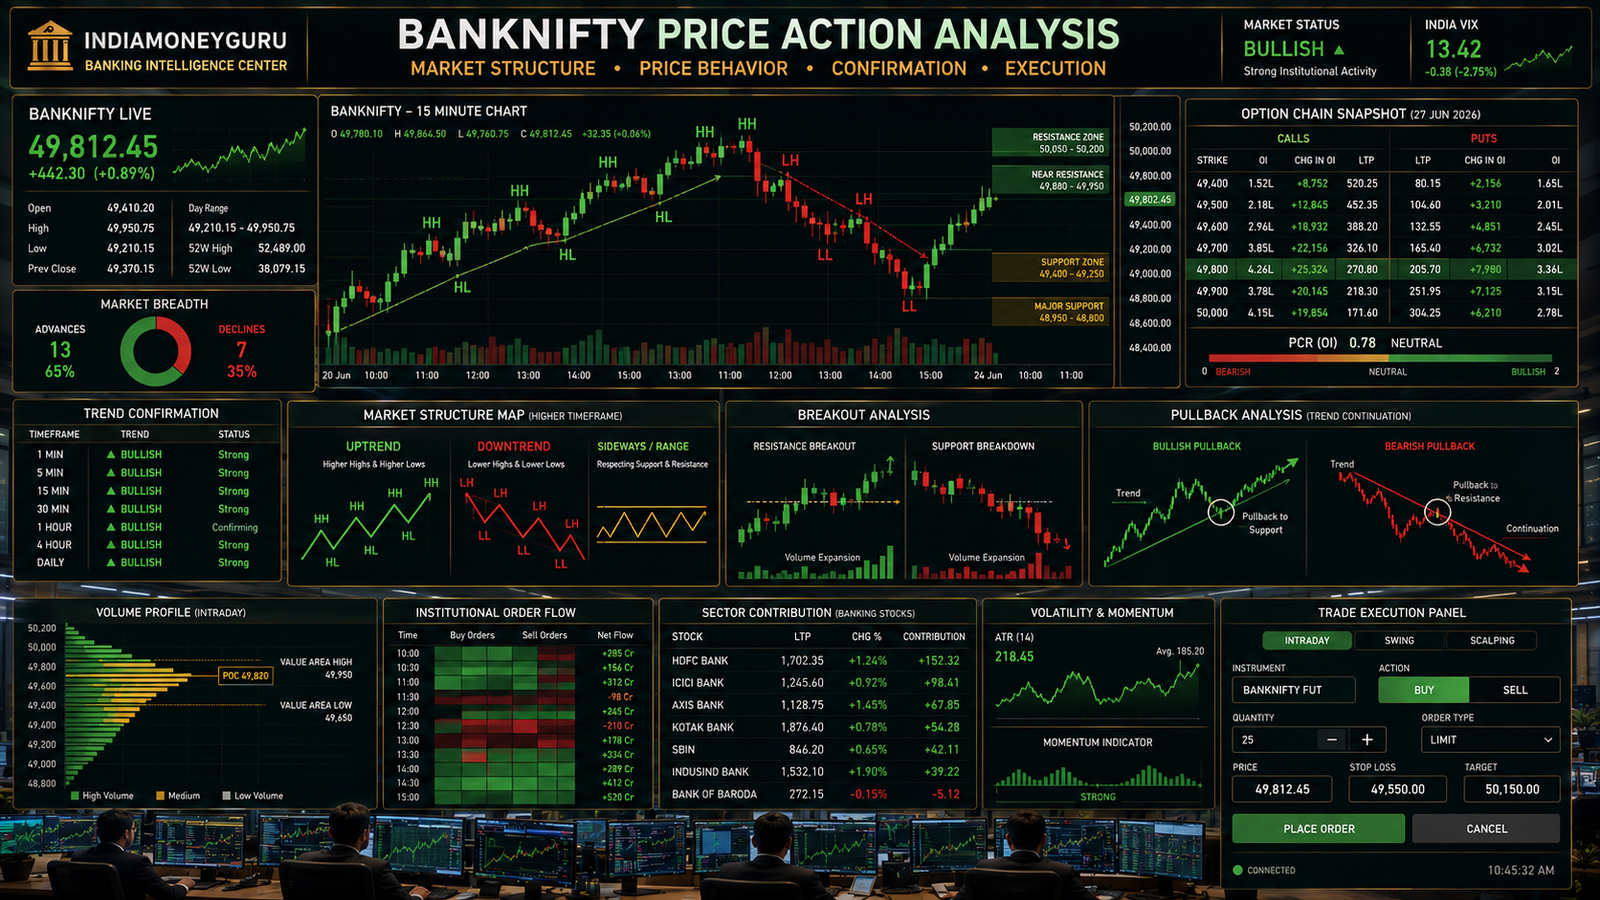
This guide explains how traders can use candlestick patterns, market structure, support and resistance, and trend confirmation to analyse BANKNIFTY more effectively.
Table of Contents
Key Takeaways
- Price action reflects the interaction between buyers and sellers.
- Market structure helps identify the prevailing trend.
- Candlestick patterns provide clues about potential reversals or continuation.
- Support and resistance become more reliable when confirmed by price action.
- Option Chain and price action complement each other.
- Confirmation is generally more valuable than prediction.
What Is Price Action?
Price action is the study of how price moves over time without relying heavily on lagging indicators.
Instead of focusing on numerous technical tools, price action traders observe:
- Candlestick behaviour
- Swing highs and swing lows
- Market structure
- Support and resistance
- Trend strength
- Volume confirmation
The objective is to understand how buyers and sellers are interacting in real time.
Why Price Action Matters in BANKNIFTY
BANKNIFTY is known for its rapid price movement and institutional participation.
Because the index reacts quickly to following events, the price action often provides earlier clues than many traditional indicators.
- Banking sector news
- RBI-related developments
- Global market sentiment
- Institutional buying and selling
Professional traders therefore use price action to confirm whether market momentum supports their trading idea.
Price action analysis is equally valuable for multi-day swing setups, as it helps identify key institutional supply and demand zones that drive longer-term market trends.
Understanding Market Structure
One of the simplest ways to analyse BANKNIFTY is by studying market structure.
Uptrend
An uptrend generally forms when the market continues making:
- Higher Highs (HH)
- Higher Lows (HL)
This indicates that buyers remain in control.
Downtrend
A downtrend develops when the market creates:
- Lower Highs (LH)
- Lower Lows (LL)
This suggests sellers are dominating the market.
Sideways Market
Sometimes BANKNIFTY moves within a defined range.
In such situations:
- Support repeatedly holds.
- Resistance repeatedly caps price.
Trend-following strategies often become less effective until the range breaks.
Important Candlestick Patterns
Candlesticks provide valuable information about market sentiment.
Some commonly observed patterns include:
Bullish Engulfing
A bullish candle completely covers the previous bearish candle.
When this pattern forms near an important support level, it may indicate buying interest.
Bearish Engulfing
A bearish candle completely engulfs the previous bullish candle.
Near resistance, this pattern may suggest increasing selling pressure.
Hammer
A hammer has a small body and a long lower shadow.
When it appears after a decline, it can indicate rejection of lower prices.
Shooting Star
A shooting star has a small body and a long upper shadow.
Near resistance, it may suggest that buyers failed to maintain higher prices.
Candlestick patterns should always be interpreted within the broader market context rather than traded independently.
Price Action at Support and Resistance
Support and resistance become more meaningful when combined with price action.
For example:
- A bullish engulfing pattern at a strong support level often provides greater confidence than support alone.
- A bearish engulfing pattern near resistance strengthens the possibility of a reversal.
This combination helps traders avoid entering trades solely because price reaches a technical level.
Trend Confirmation Before Entry
Many unsuccessful trades occur because traders attempt to predict reversals too early.
Instead, experienced traders often wait for confirmation.
Examples include:
- Break above recent swing high.
- Break below the recent swing low.
- Strong closing candle.
- Increased trading volume.
- Continuation of market structure.
Waiting for confirmation may reduce the number of trades but often improves trade quality.
Combining Price Action with Option Chain
Price action becomes even more powerful when supported by Option Chain analysis.
For example:
- Strong bullish price action accompanied by fresh Put writing may reinforce a bullish view.
- Bearish price action combined with aggressive Call writing may strengthen the bearish case.
Using multiple forms of confirmation helps reduce false signals.
Common Mistakes While Trading Price Action
Some frequent mistakes include:
- Trading every candlestick pattern.
- Ignoring the prevailing trend.
- Entering trades without confirmation.
- Ignoring support and resistance.
- Depending solely on indicators.
- Chasing large candles after significant movement.
Price action is most effective when interpreted within the overall market structure.
Conclusion
BANKNIFTY Price Action Guide provides traders with a practical framework for understanding market behaviour without relying excessively on technical indicators. By learning to interpret market structure, candlestick patterns, and price movement alongside Option Chain analysis, traders can improve the quality of their trading decisions and build greater confidence in executing BANKNIFTY trades.
Frequently Asked Questions (FAQs)
What is the BANKNIFTY Price Action Guide?
The BANKNIFTY Price Action Guide explains how traders analyse price movement, candlestick patterns, market structure, and support and resistance to make informed trading decisions without relying solely on technical indicators.
Is price action better than technical indicators?
Neither is inherently better. Price action provides direct insight into market behaviour, while indicators help confirm trends or momentum. Many professional traders combine both rather than relying exclusively on one approach.
Which candlestick patterns are most useful for BANKNIFTY?
Some commonly observed patterns include:
– Bullish Engulfing
– Bearish Engulfing
– Hammer
– Shooting Star
– Doji
– Inside Bar
These patterns become more reliable when they form near important support or resistance levels.
Why is market structure important?
Market structure helps traders identify whether BANKNIFTY is in an uptrend, downtrend, or sideways market. Trading in the direction of the prevailing structure generally offers a higher probability than constantly attempting to trade reversals.
Should I trade every candlestick pattern?
No. Individual candlestick patterns should always be interpreted within the broader market context, including trend, support and resistance, volume, and Option Chain analysis.
How can I combine price action with Option Chain analysis?
A high-probability setup often occurs when price action confirms what the Option Chain is indicating. For example, a bullish reversal near support accompanied by fresh Put writing may provide stronger confirmation than either signal alone.
What timeframe is suitable for analysing BANKNIFTY price action?
Many traders use higher timeframes, such as the 15-minute or 30-minute chart, to determine the primary trend and lower timeframes, such as the 5-minute chart, for trade execution. The appropriate timeframe depends on the trader’s strategy.
Does price action work for both intraday and swing trading?
Yes. The principles of market structure, support and resistance, and candlestick analysis apply to both intraday and swing trading. Only the timeframe changes.
What is the biggest mistake beginners make while learning price action?
A common mistake is treating every candlestick pattern as a trading signal. Successful traders analyse the overall market structure and wait for confirmation before entering a trade.
Is price action sufficient on its own?
Price action is a powerful analytical tool, but combining it with Option Chain analysis, volume, trend analysis, and disciplined risk management generally leads to more balanced trading decisions.
References
- NSE India
- BSE India
- NSE India Derivatives Education
- Reuters
- Economic Times Markets
- NSE Option Chain
- Moneycontrol
Disclaimer
The information provided in this article is for educational purposes only and should not be considered investment advice. Trading and investing in financial markets involve risk. Always conduct your own research and consult a qualified financial advisor before making investment decisions.