What Is Open Interest (OI) in Options Trading? Complete Guide for Beginners

Open Interest analysis in options trading showing NIFTY and BANKNIFTY option chain data, OI build-up, OI unwinding, support and resistance levels, and institutional market positioning.

Introduction

Open Interest (OI) is one of the most important concepts in options trading, yet it is often misunderstood by beginners. Many traders look at option chain data daily but struggle to interpret what Open Interest actually tells them about market sentiment and institutional positioning.

Understanding Open Interest can help traders identify potential support and resistance levels, track market participation, recognize emerging trends, and interpret smart money activity.

In this guide, we will explore Open Interest in simple terms and learn how it can be used effectively in NIFTY and BANKNIFTY trading.


What Is Open Interest?

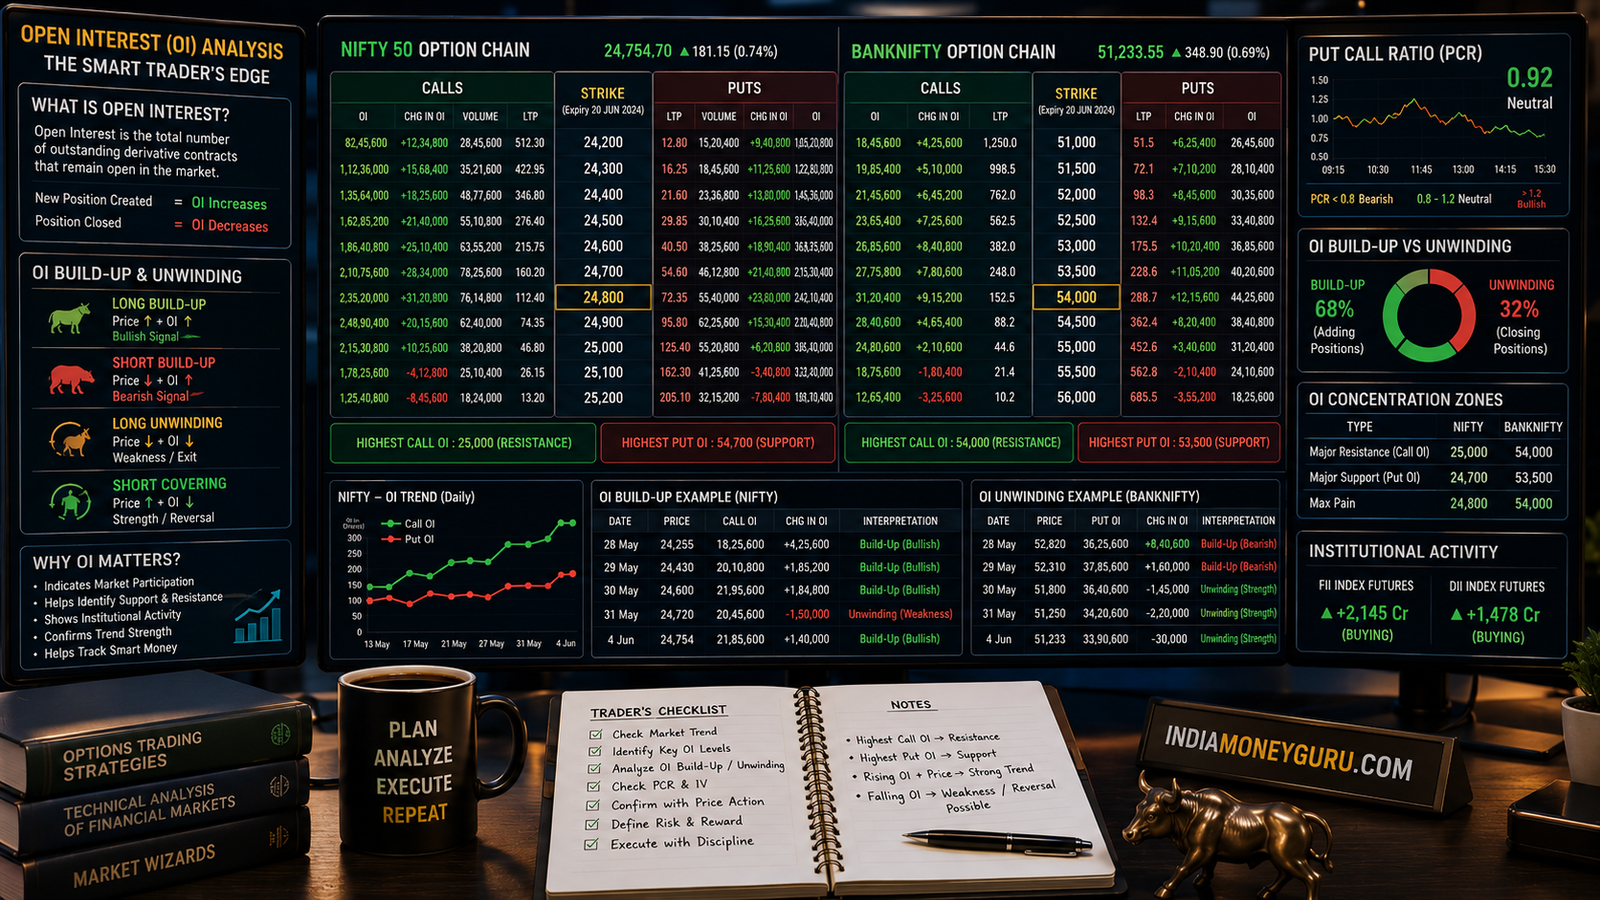
Open Interest refers to the total number of active derivative contracts that remain open in the market.

Whenever a buyer and seller create a new options contract, Open Interest increases.

Whenever existing contracts are closed, Open Interest decreases.

Unlike trading volume, Open Interest does not represent the number of contracts traded during the day. Instead, it reflects the total outstanding contracts that still exist.


Open Interest vs Volume

Many traders confuse Open Interest with Volume.

Volume

Volume measures how many contracts changed hands during a trading session.

Open Interest

Open Interest measures how many contracts remain active and open.

For example:

  • 50,000 contracts traded today = Volume
  • 12,00,000 contracts currently outstanding = Open Interest

Both metrics are useful but serve different purposes.


Why Open Interest Matters

Open Interest provides valuable information about market participation.

Higher Open Interest generally indicates:

  • Stronger participation
  • Greater liquidity
  • More institutional involvement
  • Significant support or resistance zones

Lower Open Interest often indicates:

  • Reduced participation
  • Weak conviction
  • Less reliable trading levels

How Open Interest Is Created

Consider a simple example.

Trader A buys one call option.

Trader B sells one call option.

A new contract is created.

Open Interest increases by one.

If later both traders close their positions, Open Interest decreases by one.

This constant creation and closure of contracts causes Open Interest to change throughout the trading cycle.


Understanding OI Build-Up

One of the most important concepts in market analysis is OI Build-Up.

When Open Interest increases significantly, it usually means fresh positions are being added.

However, OI alone is not enough.

Price action must be analyzed alongside Open Interest.


Long Build-Up

Price ↑ + Open Interest ↑

Interpretation:

Fresh bullish positions are entering the market.

This is generally considered a bullish signal.

Example:

NIFTY rises from 25,000 to 25,150 while Open Interest increases sharply.

This may indicate fresh long positions being created.


Short Build-Up

Price ↓ + Open Interest ↑

Interpretation:

Fresh bearish positions are entering the market.

This is generally considered a bearish signal.

Example:

BANKNIFTY falls from 57,000 to 56,700 while Open Interest rises significantly.

This may indicate fresh short positions.


Long Unwinding

Price ↓ + Open Interest ↓

Interpretation:

Existing bullish traders are exiting positions.

This often indicates weakening sentiment.


Short Covering

Price ↑ + Open Interest ↓

Interpretation:

Existing bearish traders are closing positions.

This frequently leads to sharp rallies.


How Open Interest Helps Identify Support and Resistance

Option traders often use Open Interest to locate important market levels.

Put Open Interest

High Put Open Interest often acts as support.

Put writers generally want the market to remain above their strike price.

Call Open Interest

High Call Open Interest often acts as resistance.

Call writers generally want the market to remain below their strike price.

However, traders should remember:

Open Interest levels are dynamic and can shift rapidly.

Support and resistance should never be treated as guaranteed levels.


Understanding OI Shifting

Professional traders closely monitor OI migration.

Example:

Monday:

Highest Put OI = 25,000

Wednesday:

Highest Put OI = 25,100

This suggests support is shifting upward.

Such changes often provide important clues regarding institutional sentiment.

Similarly, resistance shifting lower may indicate increasing bearish pressure.


How Institutions Use Open Interest

Institutional participants use derivatives for:

  • Hedging
  • Portfolio protection
  • Directional trading
  • Volatility positioning

Large OI additions often indicate institutional participation.

However, traders should avoid assuming that every OI increase automatically means a directional view.

Sometimes positions are purely hedging-related.


Common Mistakes Traders Make

Looking Only at OI

Open Interest without price action provides incomplete information.

Ignoring OI Shifts

Changes in OI are often more important than static OI levels.

Trading Solely Based on Highest OI

Markets frequently break major OI zones.

Ignoring Events

RBI policies, Budget announcements, and global events can override OI structures.


Practical OI Analysis Framework

Before taking any trade:

Step 1

Identify major Put OI and Call OI levels.

Step 2

Observe changes in Open Interest.

Step 3

Compare OI changes with price action.

Step 4

Monitor support and resistance shifts.

Step 5

Assess overall market structure.

Step 6

Create risk-defined trading plans.


Relationship Between Open Interest and Option Chain Analysis

Open Interest forms the foundation of Option Chain Analysis.

By itself, OI offers useful clues.

Combined with:

  • PCR
  • Volume
  • Price Action
  • Implied Volatility
  • Market Structure

it becomes a powerful decision-making framework.

For a complete understanding of option chains, read our Complete Guide to Option Chain Analysis in India.


Conclusion

Open Interest is one of the most valuable tools available to options traders. It helps identify participation, market conviction, support and resistance zones, and institutional activity.

However, successful traders never use Open Interest in isolation. The real edge comes from combining OI analysis with price action, volatility analysis, and disciplined risk management.

Used correctly, Open Interest can significantly improve trading decision-making and market understanding.

FAQs

1. What is Open Interest in options trading?

Open Interest represents the total number of active derivative contracts currently open in the market.

2. Is Open Interest more important than volume?

Both are important. OI shows outstanding positions while volume measures trading activity.

3. What does rising Open Interest indicate?

Rising Open Interest generally indicates fresh participation and position creation.

4. What is OI build-up?

OI build-up occurs when traders add fresh positions, causing Open Interest to increase.

5. What is OI unwinding?

OI unwinding occurs when traders close existing positions, causing Open Interest to decrease.

6. Can Open Interest predict market direction?

No. It provides clues about market positioning but should not be used as a standalone prediction tool.

7. How does OI help identify support and resistance?

High Put OI often acts as support, while high Call OI often acts as resistance.

8. What is OI shifting?

OI shifting refers to movement of major Open Interest concentrations from one strike price to another.

9. Is Open Interest useful for NIFTY and BANKNIFTY trading?

Yes. OI analysis is widely used by traders to evaluate NIFTY and BANKNIFTY market structure.

10. Should beginners use Open Interest?

Yes, but it should always be combined with price action and risk management.


Disclaimer

The information provided in this article is for educational purposes only and should not be considered investment advice. Trading and investing in financial markets involve risk. Always conduct your own research and consult a qualified financial advisor before making investment decisions.


References

Complete Guide to Option Chain Analysis in India (2026 Edition)

Complete Guide to Option Chain Analysis in India showing NIFTY and BANKNIFTY option chain data, Open Interest analysis, PCR interpretation, support and resistance levels, and smart money positioning.

Option Chain Analysis is one of the most powerful tools available to traders in the Indian stock market. Whether you trade NIFTY, BANKNIFTY, FINNIFTY, or stock options, understanding option chains can help you identify support and resistance levels, market sentiment, institutional positioning, and potential trap moves before they unfold.

However, many retail traders make the mistake of looking only at the highest Open Interest (OI) and assume that the market will respect those levels. Professional traders understand that option chains provide clues, not guarantees.

In this guide, we will learn how to read option chains step by step and use them effectively in real trading environments.


What Is an Option Chain?

An option chain is a table that displays all available option contracts for a particular underlying asset across different strike prices and expiries.

For every strike price, the option chain shows:

  • Call Option (CE) data
  • Put Option (PE) data
  • Open Interest (OI)
  • Change in Open Interest
  • Trading Volume
  • Implied Volatility (IV)
  • Last Traded Price (LTP)

The National Stock Exchange (NSE) provides live option chain data for all actively traded derivatives.

Option chains help traders understand where market participants are building positions and where important support and resistance zones may exist.


Understanding the Structure of an Option Chain

An option chain is divided into three major sections:

Call Side (CE)

Displayed on the left side.

Represents traders betting on upside movement or hedging bearish positions.

Strike Prices

Displayed in the center.

These are the prices at which options can be exercised.

Put Side (PE)

Displayed on the right side.

Represents traders betting on downside movement or hedging bullish positions.


Key Terms Every Trader Must Know

Open Interest (OI)

Open Interest represents the total number of outstanding contracts that remain open in the market.

Higher OI usually indicates stronger participation at a particular strike.

Why OI Matters

  • Identifies support levels
  • Identifies resistance levels
  • Shows institutional activity
  • Helps understand market sentiment

Change in Open Interest

This indicates whether fresh positions are being added or existing positions are being closed.

Increasing OI generally means fresh participation.

Decreasing OI usually indicates position unwinding.


Volume

Volume shows the number of contracts traded during the session.

High volume often confirms market interest at a particular strike.


Implied Volatility (IV)

Implied Volatility represents expected future volatility priced into option premiums.

Higher IV generally means:

  • Higher option premiums
  • Increased uncertainty
  • Event-driven risk

Examples:

  • RBI Policy
  • Budget
  • Election Results
  • US Federal Reserve Announcements

Four Important OI Concepts

Understanding OI alone is not enough. Price movement and OI must be analyzed together.

Long Build-Up

Price Up + OI Up

Indicates fresh bullish positions.


Short Build-Up

Price Down + OI Up

Indicates fresh bearish positions.


Short Covering

Price Up + OI Down

Bearish traders are exiting positions.

Often leads to sharp rallies.


Long Unwinding

Price Down + OI Down

Bullish traders are exiting positions.

Often signals weakness.


Using Option Chain for Support and Resistance

This is the most popular use of option chains.

Support Identification

Highest Put OI generally acts as support.

Why?

Put writers typically want the market to remain above their strike price.

Example:

If the highest Put OI exists at 25,000:

25,000 may act as a major support zone.


Resistance Identification

Highest Call OI generally acts as resistance.

Why?

Call writers typically want the market to remain below their strike price.

Example:

If the highest Call OI exists at 25,500:

25,500 may act as a major resistance zone.


Understanding OI Shifting

Many traders only look at existing OI.

Professional traders monitor OI shifts.

For example:

Today:

Support = 25,000

Tomorrow:

Support shifts to 25,100

This often indicates improving bullish sentiment.

Similarly, resistance shifting lower may indicate growing weakness.

Tracking OI migration provides valuable insight into institutional positioning. For a deeper understanding of Open Interest, read our complete Open Interest Guide.


What Is Put Call Ratio (PCR)?

PCR compares total Put Open Interest with total Call Open Interest.

PCR=\frac{Put\ Open\ Interest}{Call\ Open\ Interest}

PCR helps traders gauge overall market sentiment.


PCR Interpretation

PCR Below 0.8

Generally considered bearish.

More Call positions than Put positions.

PCR Between 0.8 and 1.2

Usually considered balanced.

Neutral market sentiment.

PCR Above 1.2

Generally bullish.

More Put positions than Call positions.


The Biggest Mistake Traders Make with PCR

PCR should never be used in isolation.

Markets can continue rising even when PCR appears bearish.

Markets can continue falling even when PCR appears bullish.

PCR must be combined with:

  • Price action
  • OI shifts
  • Market structure
  • Institutional activity

Smart Money Interpretation

This is where professional analysis differs from retail analysis.

Most retail traders ask:

“Where is the highest OI?”

Professional traders ask:

“Why is OI shifting?”

Institutions continuously adjust positions based on:

  • Delta exposure
  • Volatility expectations
  • Hedging requirements
  • Event risk

The real edge comes from understanding these adjustments.


Understanding Trap Moves

Option chains can sometimes create false confidence.

Common examples:

Bull Trap

Market breaks resistance.

Retail traders buy aggressively.

Institutions use the rally to distribute positions.

Market reverses sharply.


Bear Trap

Market breaks support.

Retail traders panic.

Institutions absorb selling pressure.

Market reverses higher.


How Institutions Use Option Chains

Large market participants use options for:

  • Portfolio hedging
  • Volatility trading
  • Directional positioning
  • Income generation

Institutions rarely rely on a single strike.

Instead, they analyze:

  • Entire OI structure
  • Volatility surface
  • Delta exposure
  • Risk distribution

This is why market behavior can sometimes surprise retail traders who focus only on one strike price.


Practical Daily Option Chain Analysis Framework

At IndiaMoneyGuru, we follow a structured framework.

Step 1

Analyze overall market trend.


Step 2

Identify major Call OI and Put OI zones.


Step 3

Track OI additions and unwinding.


Step 4

Monitor PCR changes.


Step 5

Assess Implied Volatility.


Step 6

Interpret institutional positioning.


Step 7

Create trading scenarios instead of predictions.


Common Mistakes to Avoid

Following OI Blindly

OI levels can change rapidly.


Ignoring Price Action

Price remains the ultimate truth.


Ignoring Volatility

IV changes can significantly impact option premiums.


Overtrading Expiry Day

Expiry sessions often contain sharp trap moves.


Trading Without Risk Management

Even perfect analysis can fail.

Always define risk before entering a trade.


Conclusion

Option Chain Analysis is not a prediction tool. It is a probability tool.

The objective is not to forecast the exact market direction but to understand how market participants are positioned and where important support, resistance, and risk zones exist.

When combined with price action, risk management, and market structure analysis, option chains can become one of the most valuable tools in a trader’s arsenal.

Successful traders focus on probabilities, not certainty. Option chain analysis helps improve those probabilities.


Frequently Asked Questions (FAQs)

1. What is Option Chain Analysis?

Option Chain Analysis is the process of studying Open Interest, volume, implied volatility, and option positioning to understand market sentiment and potential support and resistance levels.

2. Is Open Interest more important than volume?

Both are important. OI shows existing positions while volume shows trading activity.

3. Can option chains predict market direction?

No. They provide clues about positioning and probabilities, not certainty.

4. What is PCR?

Put Call Ratio compares Put OI with Call OI and helps measure market sentiment.

5. What is a good PCR value?

Generally, 0.8–1.2 is considered neutral, but PCR should always be interpreted with other market factors.

6. Which is better for analysis: NIFTY or BANKNIFTY?

Both are useful. BANKNIFTY is generally more volatile, while NIFTY often provides broader market direction.

7. How often should option chains be checked?

Active traders typically monitor them throughout the trading session, especially near important market levels.

8. What causes OI shifts?

Fresh positioning, hedging activity, institutional adjustments, and event expectations.

9. Why do support and resistance levels sometimes fail?

Institutions can shift positions rapidly, causing previously strong OI levels to lose significance.

10. Is option chain analysis enough for trading?

No. It should be combined with price action, volatility analysis, and risk management.


Disclaimer

The information provided in this article is for educational purposes only and should not be considered investment advice. Trading and investing in financial markets involve risk. Always conduct your own research and consult a qualified financial advisor before making investment decisions.


References